
September 5, 2018
Last updated
min read
Location intelligence is vital to the function of private and public entities. Modern technology now allows for more location data to be created and captured than ever before. Geosocial data is one example of location intelligence that has a proven impact on real world business decisions. Although this information has technically been available since 2009, it only recently has been tapped into as a usable source of data. The purpose of this guide is to explain what Geosocial data is, how it is organized, and to provide some example use cases.
People have been trying to understand human activity as it relates to location for much of recorded history. Over the years, various techniques have evolved, leading to deeper insights that were previously impossible to find. Today, we can understand people in places at a level not feasible even just ten years ago. But to understand the state of location intelligence now, we need to start at the beginning.
First used as long ago as Babylon and the Roman Empire, the census is an attempt to count and estimate the population and demographic makeup of a region. The US has completed a census every ten years since 1790. This provides valuable information about the population, who we are, where we live, and where we work. Due to the vast amount of time and manpower required, a census can only be done each decade. As a result, the data is often not up-to-date. Additionally, census procedures can be subject to political pressures and some demographics are reluctant to report accurate information. Regardless of these limitations, census data is the standard for location intelligence and is used for many decisions, both in government and the private sector.

When more recent or specific data is needed about a place, researchers survey the people there. Unlike a census, which tries to answer many broad and objective demographic questions, surveys often focus on a very narrow set of questions like, “How many times have you ordered pizza in the past month?” They do not attempt to question as many people as a census, but instead try to get a representative sample of the population.
The development of probability sampling methods in the 1930s made it possible to do a survey and understand how well it represents the population as a whole. Many different methods of sampling are used, but it is impossible to completely eliminate sampling error. Additionally, the words used within the questions themselves introduce bias into surveys, and this can be an accidental reflection of the researcher’s prior opinions. While surveys are commonly used to measure opinions on a wide variety of subjects, it is difficult to gauge the error in the data.

For a lot of planning and retail decisions, it is important to know how many people visit a place. This is done by simply counting. If you want to know how many people visit a shopping mall on a given day, you can count the number of people entering and exiting each hour. Originally, employees would literally count every person, but in the early 2000s, infrared counters automated this task. However, automated counting often has a high margin of error and is not able to distinguish customers from staff.
The first highway traffic counters were introduced in the 1930s, enabling automated counting of automobile traffic. But even with an accurate count of visitors per day, a lot of questions are still not answered. Why are those people in that location? How many are visiting that location for a reason versus passing through to go somewhere else? Counting by itself cannot answer these questions.

As people began to do more things online, measuring web traffic became more prevalent. Websites, search engines, and service providers started collecting all kinds of data derived from internet traffic. In 2002 a company called MaxMind started providing a lookup service to link an IP address with a physical address. This type of location data connects something behavioral such as a search query or a website action with an approximate real-world location. This connection made it possible for online sellers to correlate behaviors with location to measure regional demand for products. While this was a connection between behavior and location, it only gave a small insight into the behavior. This is because search activity only reveals what people care about, not why. In addition, this location data is often not very specific. It can usually narrow the user’s location to a city, but sometimes it can only identify the country of origin. It can also be confused by more complex networks and provide inaccurate information.

Retailers and credit card companies collect and analyze data about purchase behavior, both online and in-store. By combining all these data points, they gain some insights into buying patterns by place. Although purchase data is often used to make assumptions about consumers’ personalities, patterns of buying behavior only tell what people are spending money on, not why.

In 2005, new GPS satellites began transmitting a civilian signal enabling our phones to use GPS for navigation and 911 calls. Mobile phone companies started tracking positions of all the phones on their networks using signal triangulation and the internal GPS of the phones. Soon they had thousands of data points on the position of each phone at almost every minute of the day. This data shows commute routes, foot traffic at any location, and how many people stopped at places rather than just passed by. This was a level of awareness that had never been achieved before. The massive cloud of data represents single-dimension point of information on where people are and at what time. Like counting traffic, mobile location data measures how many devices are at a place, but it lacks any qualitative information about people.

As you can see, there is a variety of location data types out there, each with their pros and cons and different use cases. But with the dawn of social media and geotagging, a new type of location data has emerged: Geosocial data.
As we mentioned in the introduction, the concept of Geosocial data has been around since 2009 — when Twitter first announced their geotagging feature. But what is Geosocial data? And how is it different from typical social data?
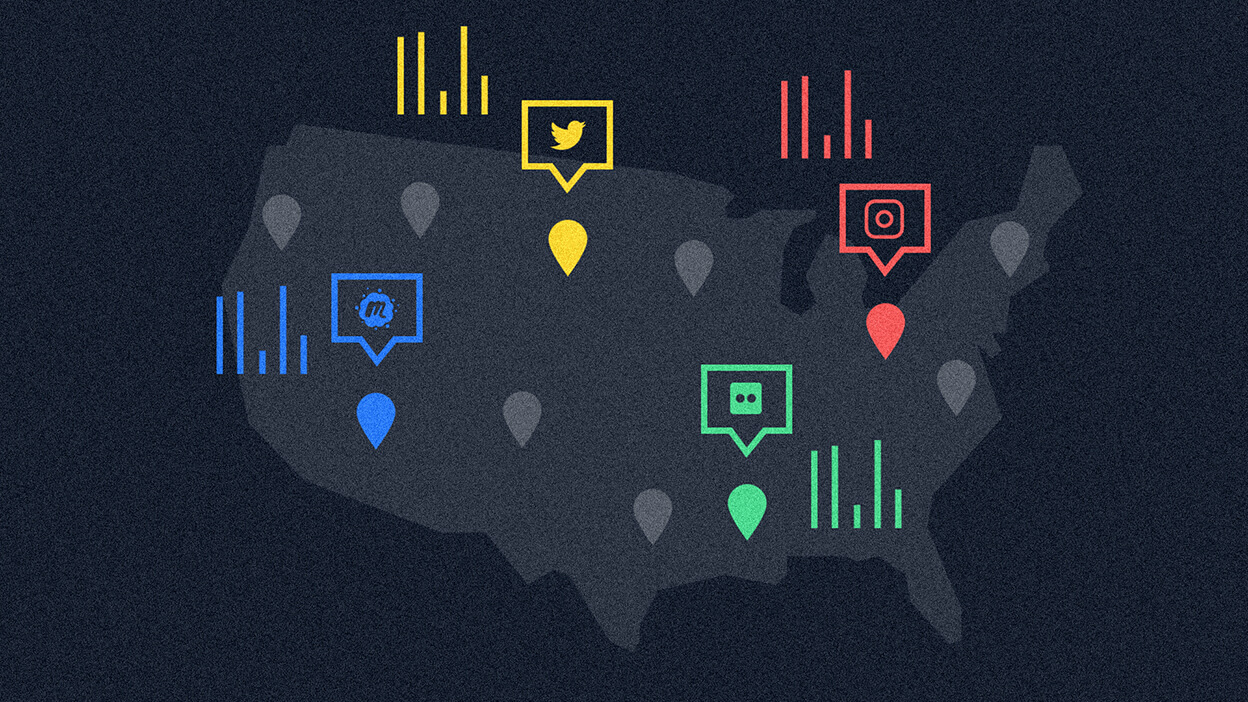
Geosocial data is simply location-based social media data. It is media content (mostly text) produced by people on social platforms that is tied to specific locations. The location component is often coordinates in latitude and longitude, but it could be a tagged place or street address as well. This type of data is publicly available on nearly every major social platform including Twitter, Instagram, Flickr, event platforms, review sites, etc.
The richness of Geosocial data comes from the constant stream of content people post on social media — content like thoughts, feelings, interests, events, and activities. Communication combined with location information is the essence of Geosocial data.
Want to explore the data yourself? Download sample data.
People talk about the things that are meaningful to them and believe others will find compelling. Some of the content may seem trivial, such as what someone’s dog did before they left for work, or what a person had for lunch. But thousands of these tiny communications are like brush strokes on a canvas. Each tweet or post is just a tiny point, but when you look across entire neighborhoods, they combine to form a rich, colorful picture.


Another way to think about Geosocial data is like an ideal survey. People are freely and organically contributing data. Plus, the sample size and geographic scale is massive. The challenge is knowing what questions they are answering for us. The data is messy, and to the naked eye it is hard to know how to apply it. However, by using artificial intelligence, data scientists are able to identify meaningful patterns and organize the data into usable social segments.

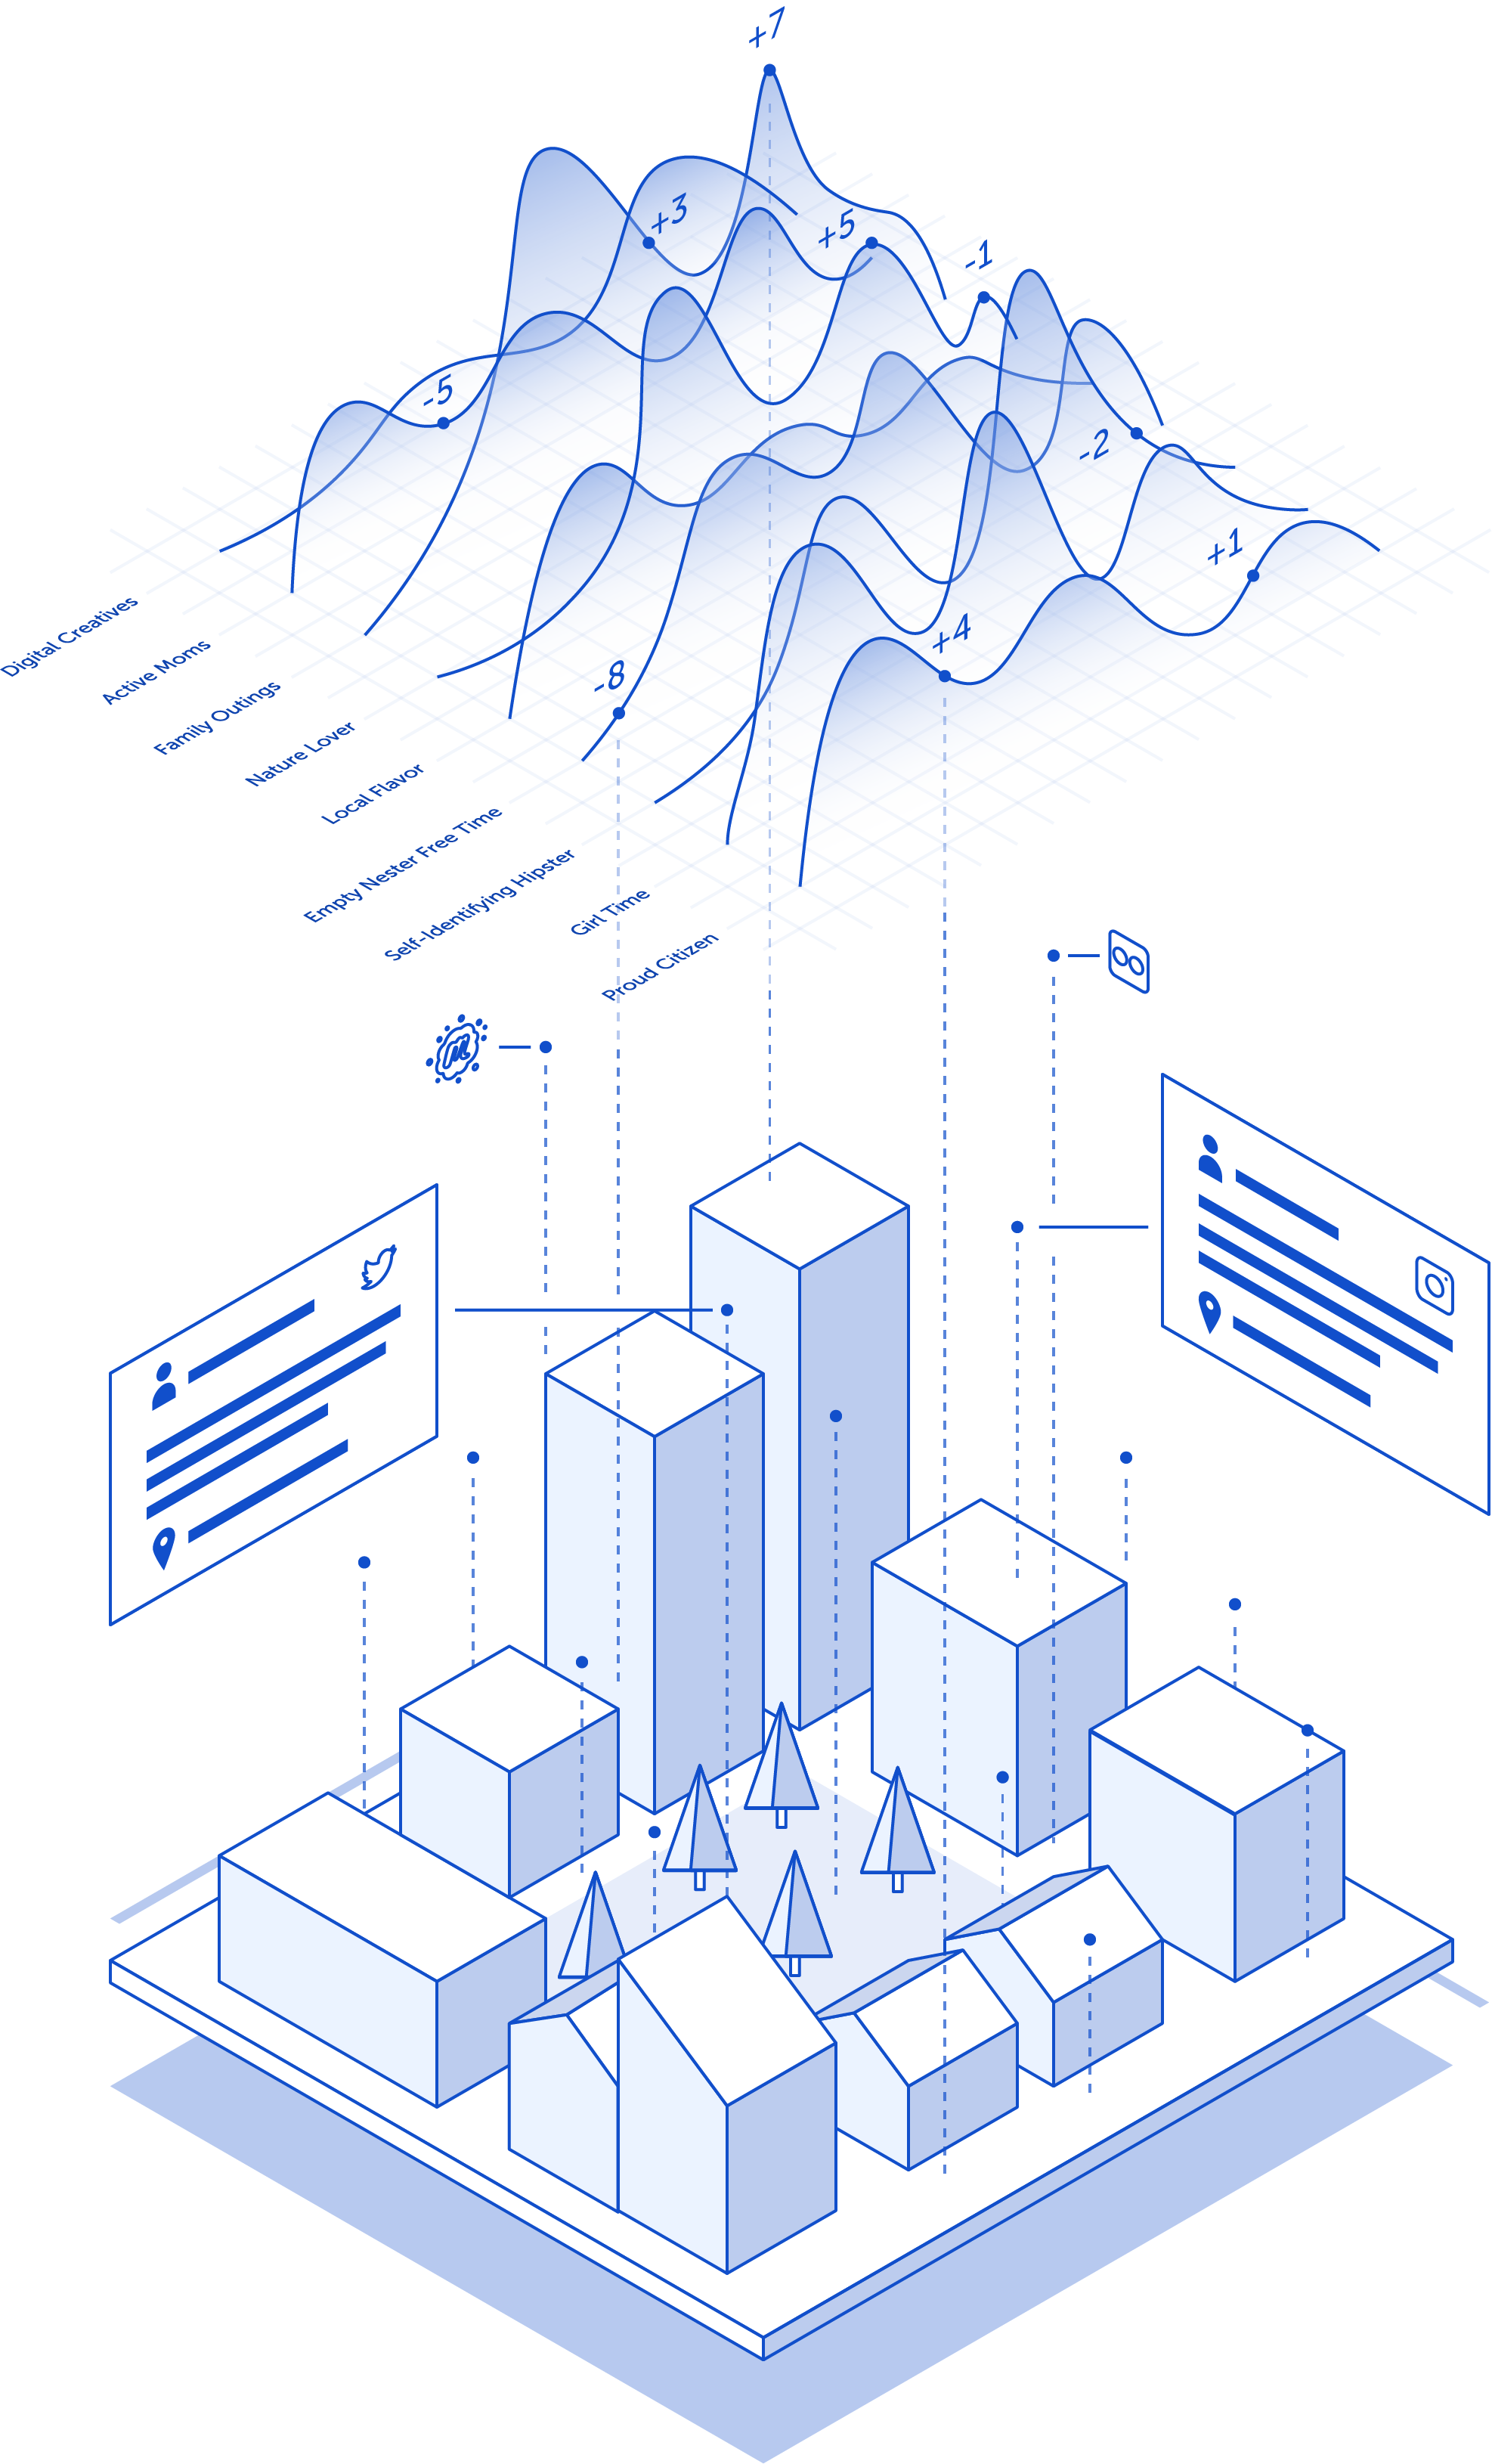
To make this data usable, it can be organized into specific personalities or behaviors that are commonly present in communities. We call these specific, refined, and defined groupings of Geosocial activity “social segments.”
Take for example, the social segment “Mindfulness & Spirituality.” This segment is driven by activity related to people focused on a meditation and related behaviors. They share on social media about topics such as breathing, gratitude, meditation, and healing. Once a segment has been identified, it can be measured anywhere in the world and compared across different geographies.

For a list of over 70 personalities and behaviors that can be measured using Geosocial data, explore our taxonomy here.
Misconceptions often arise from comparing Geosocial data with other datasets, specifically social data. This is a reasonable thing to do given that the only visible difference between the words is the prefix “geo.” But thinking of Geosocial data in the same terms as traditional social data or mobile location data loses the fundamental nature of what Geosocial data is.
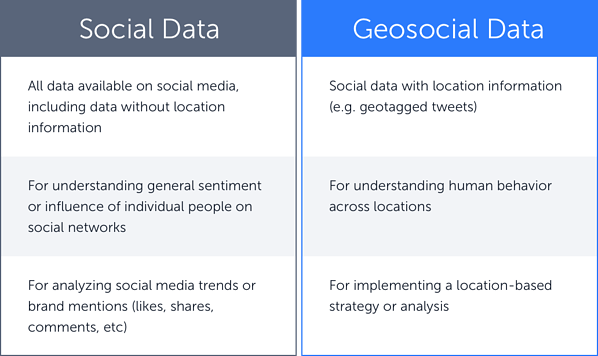
Social data is any data people post on social media platforms. Geosocial data is social data with a location component. We define it separately because having a location component gives the data additional meaning and the uses cases are significantly different. Geosocial data is primarily about understanding a location, while social data is concerned with the opinions and influence of individual people on social networks as a whole.
The important question to ask when determining whether social or Geosocial data is appropriate is, "What is the use case?" If you would like to analyze social media trends or your brand’s mentions on social networks, then typical social media data is what you’re looking for. However, if you are trying to implement a location-based strategy or analysis, then Geosocial data is best.
Geosocial data is messy. People don’t just answer the questions you want to ask. They talk about whatever they feel strongly about. This data contains practically every topic you can think of, and it shows where people are expressing these interests. With so many dimensions to this data, it is hard to use until it is organized into a form suited for the application or question being asked.
So how do you do that? That is what we will talk about in the next chapter.
Making sense of the billions of data points on social media is an impossible task for any human to accomplish. This is where data science and data modeling come in. One way to organize the data is by implementing machine learning techniques to identify patterns. Without getting too technical, we will walk through how this is done.
Data modeling is the process of creating a mathematical function which describes a data set. This may describe the types of data found in the data set, or relationships between entities, or properties of groups in the set. This can be done manually and in an automated fashion, but typically it is done as a mix of automated processing and manual examination.
Data scientists describe models as being predictive or descriptive. The difference is in whether you are trying to answer questions about what is in the data set, or trying to infer something (such as future behavior) which is not already in the data set.
Data scientists use descriptive models to reveal patterns and relationships in data. These models are used to identify trends, such as visualizing the seasonality of different foods. Descriptive models can also be used to discover unexpected correlations, such as finding similar neighborhoods in different cities or figuring out why certain products sell well in Austin but not in Dallas.

Predictive models enable inferences about data which is not yet in the data set. One prediction which many people try to make is financial performance of a product in a new market. Based on similar locations, how should the same product perform in this new location?
Other uses for predictive models include making recommendations. A company that owns retail properties may use a recommendation approach to identify which tenants they should recruit for a vacancy.

An important tool for data modeling is machine learning. Instead of human data scientists trying to find an optimal model, they instruct the machine to choose the model which best fits the data. The machine can learn the parameters for the model based on data, and can often generate a better fit than a model configured by humans.
When it comes down to it, machines learn in a similar way to how humans learn. For example, one way humans learn is by observing the behavior of others in similar situations. A human can instruct a machine learning algorithm to observe some variables (whether it was cloudy, the temperature, wind speed, etc.) and outcomes (whether it rained that day) to learn what patterns in the variables predict the outcome. This is known as supervised learning.
Sometimes, however, there are no outcomes to predict, and we simply want to notice patterns in the variables. For example, given the text from a bunch of different books, can we group them together by their topics? This is known as unsupervised learning, because there aren’t any pre-made correct answers.
The process of a machine learning algorithm finding those patterns, and, in supervised cases, learning what outcomes are associated with those patterns is known as training. The key advantage of machine learning is that the computer can look at data faster and search for interesting patterns faster than a human can. For instance, a computer could process the last 10 years of weather data for a location before a human could even finish looking at the first week! With all of this processing power, it can look for more patterns than humans could feasibly look at on their own. For more, read our AI Whitepaper.
Even with machine learning to generate a model from the data, the human data scientist still needs to interpret and evaluate the results. How well does the model predict properties of test data? Does it infer patterns that we expected to see? How well does it fit the whole data set? The machine just follows mathematical rules, without any context or meaning. The data scientist must use domain specific knowledge to determine if the model is correct and useful or start over with different data.
In addition to the science, there is an art to interpreting data, and sometimes patterns are discovered intuitively rather than mathematically. This can be done by understanding the context of the data and knowing what kinds of patterns might exist. It can also be done with visualizations which can make patterns visually discernible.
Prior understanding of the domain is the biggest source of insight. If the data is being used to make predictions for a retail business, the knowledge the business already has about their customers gives the data scientists some idea of what social content is likely relevant to their outcomes. Once that content is identified and correlated with the business sites, other correlated content may be discovered which was not previously known.
Visualizing the data can provide insights by enabling people to intuitively grasp patterns. Some types of patterns are very visible when graphed, such as correlation or regression. Superimposing colors to indicate social content types on a map is very useful for understanding Geosocial data. This can be done on a simple grid or by neighborhood boundary. The insights you can gain depend a lot on how the data is displayed, so it is helpful to try multiple visualization forms.
It all depends on the data and the application. If you have a lot of domain expertise, you know what to look for in the data, and you can understand the machine generated models much more easily.
Each application of Geosocial data is about finding the best match between business needs and social activity in communities. Using data that shows where an activity is popular, you can identify the Geosocial segments in common between those locations. Then you can predict how popular that activity will be in other locations based on their Geosocial data.
One of the big challenges of expanding a retail chain is finding the right location. A typical lease is a long term commitment, often ten years or more. Poor choices are extremely expensive. A reasonably priced location in a well trafficked area may sound like a great deal, but if the people in the area are not a good match for your type of business then it will be a loss.
The relationship between business success and Geosocial segments can be seen in the Payless Case Study. Many of the stores they closed were not very far from others which remained open. Why did one store do well, while a nearby store did poorly? The answer is that people in one area had different personalities than people in the other area. The Geosocial data revealed patterns in these areas which predicted the performance of Payless stores.
Purchasing and developing real estate requires some long term planning to be successful. You have to understand the needs of the community surrounding that location. If your company owns a shopping center, it pays to lease to a client you expect will be a good fit for that location. If you lease to the wrong client, they may go out of business, leaving you with an empty building and less revenue. Incorporating a strategy that ensures your tenants match the social context of a community is key to optimizing your recruiting efforts.
Video: Geosocial Leasing Use Case
How do you understand what the community wants? Geosocial data shows what people in the community are interested in. Using the Geosocial profile of the area around your site, you can find other areas where people have similar activities and interests. Comparing the businesses in those other areas with the selection near your site, you can see what your area might be missing. If all of the similar areas contain discount stores, opening a high end retail store might be a poor fit. If there is an abundance of coffee shops in the matching areas, but fewer near your site, then that might be an unmet need.
Use Geosocial analysis when deciding which properties to buy or pass over. Any major real estate decision should be made with the maximum amount of information available to aid the evaluation. Geosocial analysis on your existing portfolio and applying a comparison to new properties can help you predict what this new area's strengths and weaknesses will be.
What are the needs of your city? What projects will have the biggest positive impact? Typically, city planners are looking at census figures for demographics, as well as conducting lots of interviews and surveys. What things are important for people in your city? What are the pain points?
Geosocial data reveals the personality of every neighborhood in your city. If you are considering building a park, nearby neighborhoods strong in Healthy Living, Nature Lover, or Dog Lover segments might be a strong source of support. Building a shopping center in that space instead might encounter more resistance. The future of cities must be human-centered if cities are not only going to survive, but thrive. Geosocial data helps us do that by building cities based on real community needs and interests.
Check out Ford’s City of Tomorrow Challenge for an example of how Geosocial data can be incorporated into these efforts.
Video: Urban Planning Use Case
Advertisers use analytics to maximize the reach and conversions for a variety of advertising media. Geosocial data now makes it possible to understand what people are doing and talking about in various locations. Whether it is a billboard, local radio spot, or location-targeted mobile ad, it is more effective to advertise in an area that you know will be receptive.
Additionally, by identifying the segments that are impacting your business the most, you can target your advertising to other areas which score highly for those behaviors. This is a high ROI practice that can maximize the effectiveness of your campaign spending.
Related: How to Super-Charge Your Marketing Strategy with Geosocial Data
When stocking the shelves in a grocery store, hardware store, or fashion boutique, how do you decide which products to stock, and in what quantities? It all depends on what your customers are likely to buy. Maybe some locations prefer organic grocery products, while other locations do not have a preference. This could be more than just which product is less expensive.
If you know which groups of products are selling better in which locations, you can combine that data with Geosocial data to find a better mix of products for each location. You can sell more organic kale to an area with a strong “Healthy Living” segment, and you might sell more nacho cheese and pizza in an area with a stronger “Sports Entertainment Lovers” segment.
Your company produces soaps, lotions and perfume, which are carried at a wide range of stores. You want to place your products at the stores where the demand will be highest, so that they sell faster. Additionally, if you place the wrong product at a store, that product will move slower and fill up shelf space which could be selling a different product much faster.
You can use the sales numbers by market to create a Geosocial profile for each product. That profile can be used to predict relative sales of each product by location. You can then adjust which products you stock in a location or adjust local prices for the product so that you sell more at better margins.
Geosocial data is already helping companies and cities build a world designed around human interests. Businesses are serving their customers more effectively because they deeply understand consumer personalities and natural preferences. As a result, Geosocial data is proving itself to be a tool that enables more human-centered decisions across all industries.
Interested in learning more about Geosocial? Here are a couple options:

