
January 18, 2018
Last updated
min read

When a dry cleaning franchise with over 60 nationwide locations wanted a sure win for their next site, they knew they had to approach the site selection process differently. Certainly they valued the data organized in reports they receive from Buxton or other leading sources, but a voice was missing in retail location intelligence. And they suspected it might be important.
Dry cleaners face the same challenges as other retailers when it comes to selecting a site that is located in the right place, but they have the additional burden of standing out in an industry that, while still extremely relevant, is steadily declining—and is, in fact, expected to drop from $9.1 billion to $8.7 billion in 2020 (IBIS). Through no fault of their own, dry cleaners have a variety of factors at work against them: more casual work cultures, more telecommuters in sweatpants, more “disposable” fashions available to consumers, among others. Being the dry cleaner people choose is imperative, which means they can’t afford to gamble on finding the right location.
As expected, this dry cleaner turned to data to make an informed choice, specifically using data to forecast expected revenue for new sites. Yet they had good reason to worry that their site selection intelligence wasn’t good enough. With their existing model, they had already picked a few “wrong” locations, some underperforming by $200,000 per year. Combine that with new site startup costs and a minimum 10 year commitment, and each poor decision was a $2M+ loss. On average, the dry cleaner’s current sales projections for new sites missed the mark by 19.5%.
Like many retailers, much of the information needed for analysis (population, income, demographic) is sourced from census data, which is updated once a decade. When inputting old data into predictive models or network optimization, both become a lot less reliable. The dry cleaner had tried to take advantage of movement data (e.g. traffic and mobile), purchase data, and survey data, but even that failed to capture the organic conversations that reveal the target demographic.
Only one kind of data indicates exactly where people are having experiences, what those experiences are, and how people feel about them: social media data.
To determine what social media data could reveal about their next new site selection, the dry cleaner turned to Spatial.ai, the leading provider of location-based social media data analysis. Spatial.ai creates custom “Social Indicators” to help businesses determine which aspects of social media interaction impact their businesses and whether or not a particular location is a good fit based on that data.
First, the dry cleaners sent a file to Spatial.ai that included a sample of their current sites nationwide and the revenue data for each location. That way, Spatial.ai could analyze current store performance to find patterns in social media data that could be useful in new site evaluation and current site optimization.
With this analysis, Spatial.ai determined the optimal predictive blend of their proprietary 550 machine learning-enhanced social categories, identifying which individual categories had the biggest impact on the model and which categories had the most positive—or negative—correlation. They reported these insights, breaking down some of the top-performing segments to give the dry cleaner insight into their customers’ lives, including a “stories” element to help interpret the indicator scores.
Right away, the discovery confirmed what the dry cleaner suspected: social media data does offer location-based insight. Dry cleaner revenue is highest when located within close proximity of these social categories:
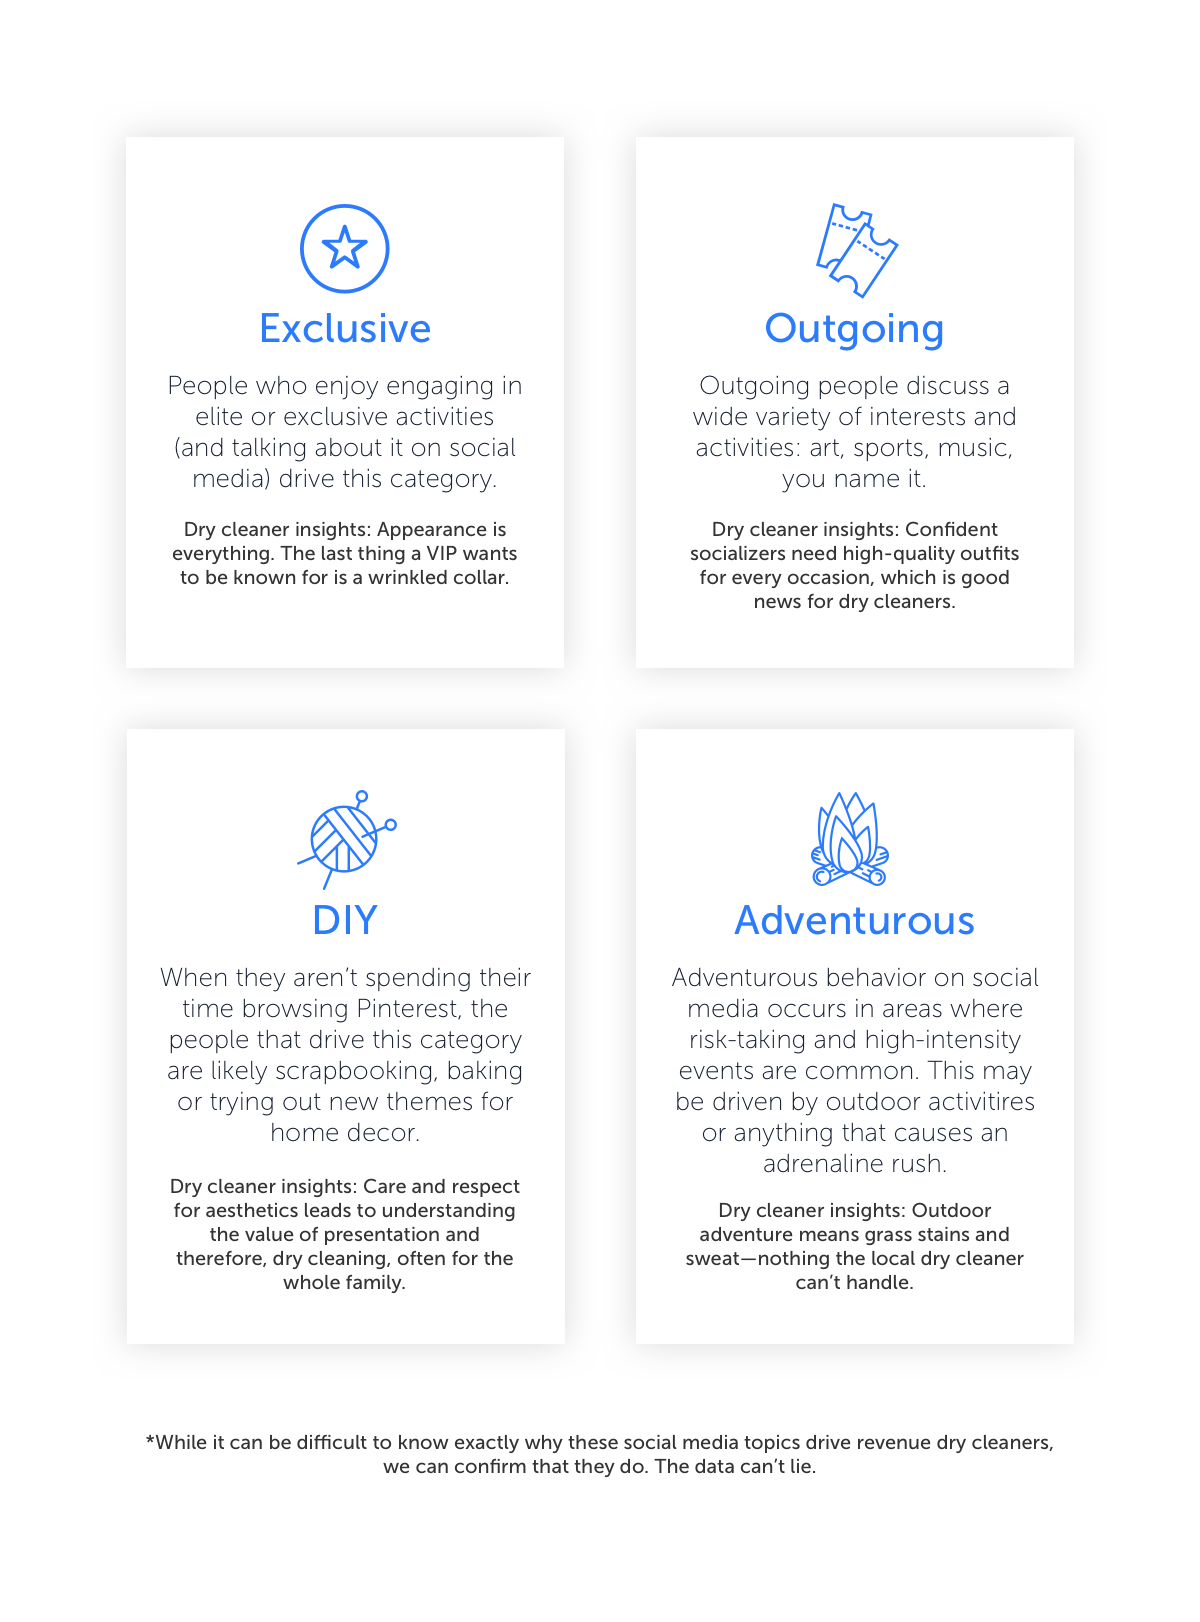
Social media revealed a compelling story about the best location for a dry cleaning business. Most importantly, however, the correlation Spatial.ai discovered revealed whether or not these categories actually improved the dry cleaner’s ability to forecast revenue. The answer is a resounding yes. With this information, anytime they dry cleaner is scoping a new site, they can request a custom Social Indicator (scored based on their outcomes, for a single location) that predicts how likely that site is to perform better or worse compared to the dry cleaner’s average.
Some of the behavioral data confirmed what this dry cleaning company had long intuitively believed but could never officially capture. Other parts of it created “aha” moments because, in context, they make so much sense. DIYers, for instance, often homemakers or moms, had always been a key demographic. But VIPs? That was a new angle—and social media was a new way to to prove their impact on dry cleaner success.
And what about the hard metrics? When the results of the custom Social Indicator were compared to the dry cleaner’s current model outputs, Spatial.ai was able to account for nearly half of the missing signal from their existing estimates, bringing their new site revenue projection accuracy from missing by 19.5% down to missing by 10.14%. The dry cleaner estimates that based on the next year of planned new sites alone, using Spatial.ai’s custom Social Indicator as a part of their site selection strategy will result in $500K more per year than their current strategy.
Bottom line: Spatial.ai reduced the amount of error in the dry cleaner’s current revenue predictions by 48%, meaning they will open more good locations and fewer underperforming locations. This was accomplished by Spatial.ai’s ability to quantify real human emotion and personality over location and mathematically prove that social media data is relevant to retail store performance.


.jpeg)